A dashboard reads one thing: a dataset, a spreadsheet your team uploads, or a register from one of your apps, read live. Its widgets each ask that data one question, and the people it is shared with see the answers.
Building dashboards needs the Build dashboards permission, which Admins have by default. A dashboard on a dataset needs it where the dataset is kept. A live dashboard needs it across the whole workspace, and the register's app installed.
Make a dashboard
In Dashboards, choose New dashboard. The editor opens as a page of its own.
Give it a Name.
Choose what it Reads (1): one of your Uploaded datasets, or a register Live from your apps. To use a spreadsheet, upload it as a dataset first.
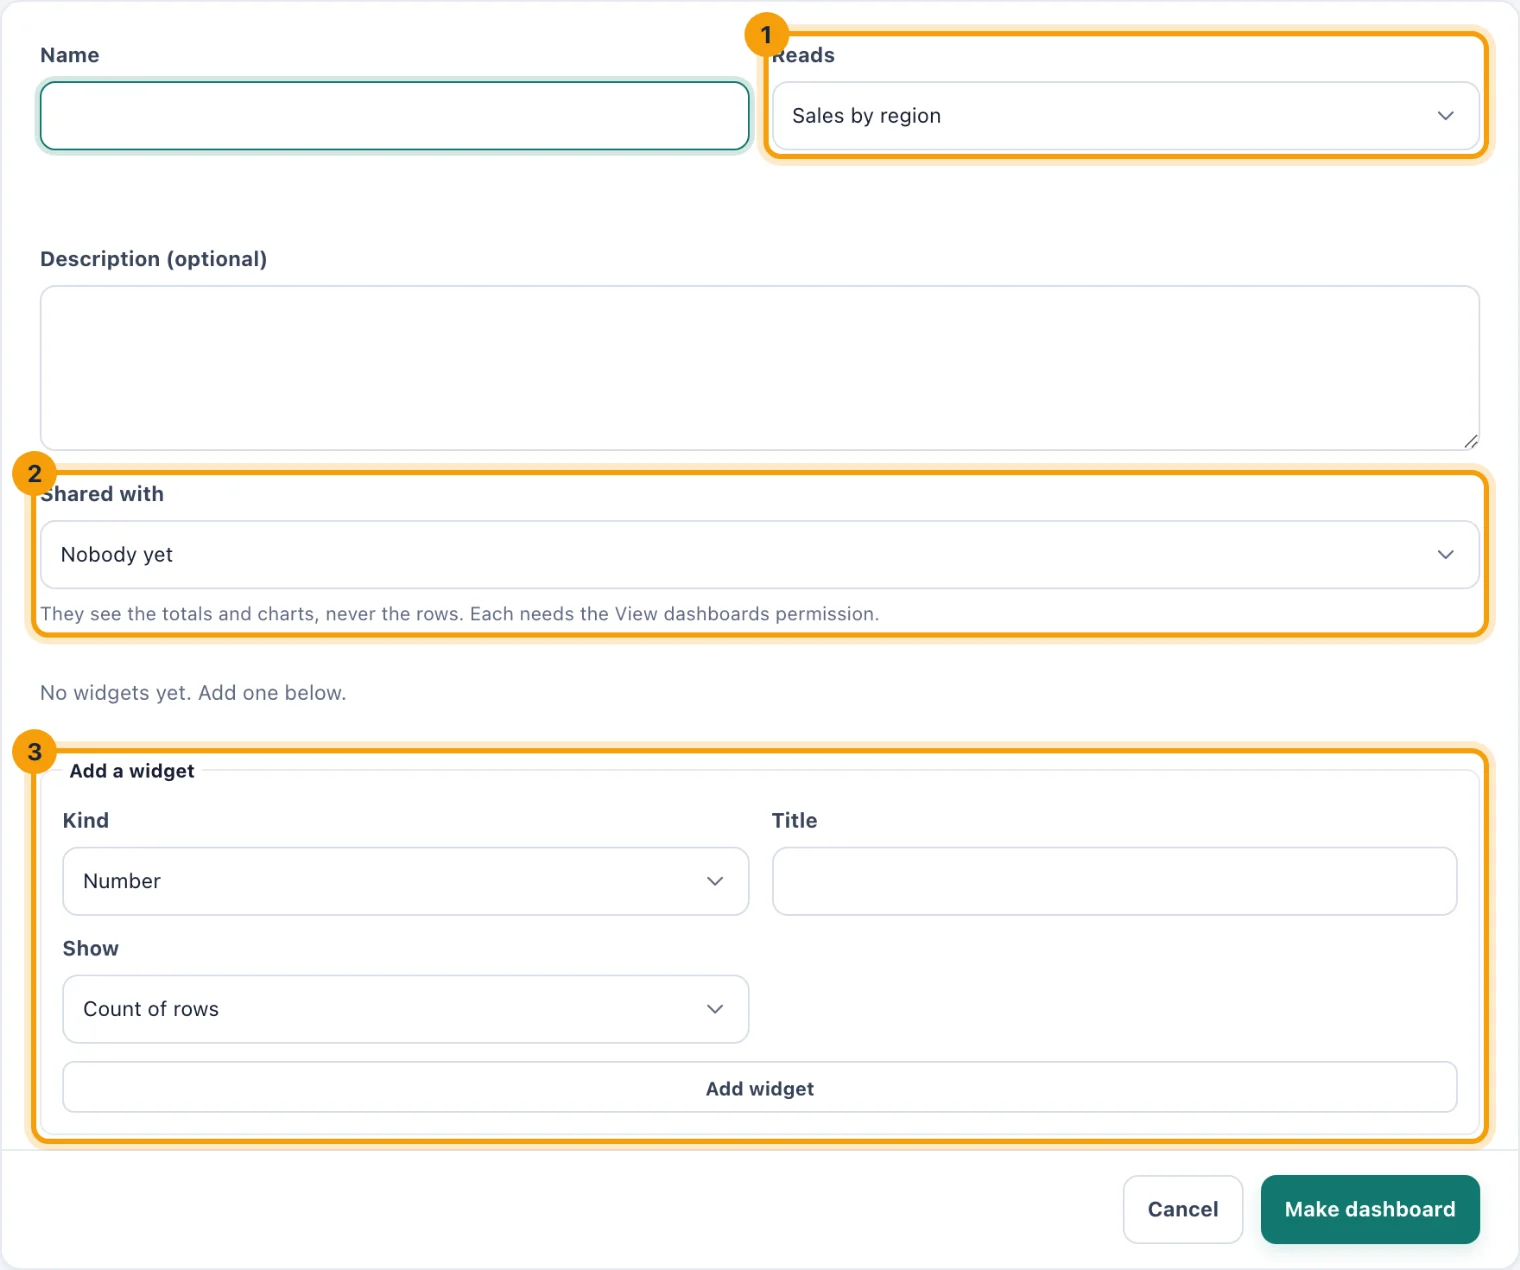
New dashboard: what it reads (1), who sees it (2), and its widgets (3). Add a Description (optional) to say what it is for.
Choose who it is Shared with (2): Nobody yet, Everyone, People at chosen locations, Chosen departments, Chosen teams, Chosen groups or Chosen people. For the chosen ones, pick them in the Choose list that appears. They see the totals and charts, never the rows, and each needs the View dashboards permission.
Add its widgets under Add a widget (3). See below.
Choose Make dashboard. It opens, as the people it is shared with will see it.
What a dashboard reads cannot change once it is made: make a new one for other data. Choosing another source while you are still making it clears the widgets added so far. If there is no dataset with data in it yet and no register you can read, the page asks you to upload a dataset first.
Add a widget
Choose its Kind: Number, Bar chart, Line chart, Table or Text.
Give it a Title. Every widget needs one.
Choose what to Show: Count of rows, or the Sum of, Average of, Smallest or Largest value of a number Column.
For a bar chart, a line chart or a table, choose the column it is Grouped by. A line chart runs along a date column. Dates are grouped by month.
For text, write it in Text.
Choose Add widget. It joins the list above, in the order you add them; Remove takes one out.
A dashboard holds up to 24 widgets.
Live from your apps
A live dashboard reads a register as it is now, rather than a spreadsheet. Two can be read:
Service Desk tickets: queue, category, location, status, priority and who has each ticket; when it was raised and resolved; whether it was answered and resolved in time; the hours to the first answer and to resolve it; and its rating.
Vendors: category, location, status, billing, currency, monthly and yearly cost, seats bought and used, the renewal date and the last day to cancel.
Only labels, numbers and dates are read, never a ticket's subject or a note, so a widget shows a total and never what somebody wrote. Each person it is shared with sees totals of only the records they can open. A live dashboard answers from at most 20,000 records; past that it says so rather than counting part of them.
Change or archive a dashboard
Open the dashboard and choose Edit (1). Change its name, description, sharing or widgets, then choose Save dashboard.

Choose Archive (2), then Archive, to take a dashboard away. Nobody it is shared with sees it any more.
Anyone who builds dashboards where its data is kept can change it, not only the person who made it.