A dataset is a spreadsheet your team keeps, such as sales by region or monthly headcount, uploaded so that dashboards can ask it questions. It is read once, when you upload it, into rows and columns. Each new upload is a new version, and dashboards always read the newest.
Datasets are for the people who build dashboards: it takes the Build dashboards permission where the dataset is kept, which Admins have by default. People a dashboard is shared with see its totals, never the dataset's rows.
Open Dashboards in the Console sidebar, then the Datasets tab.
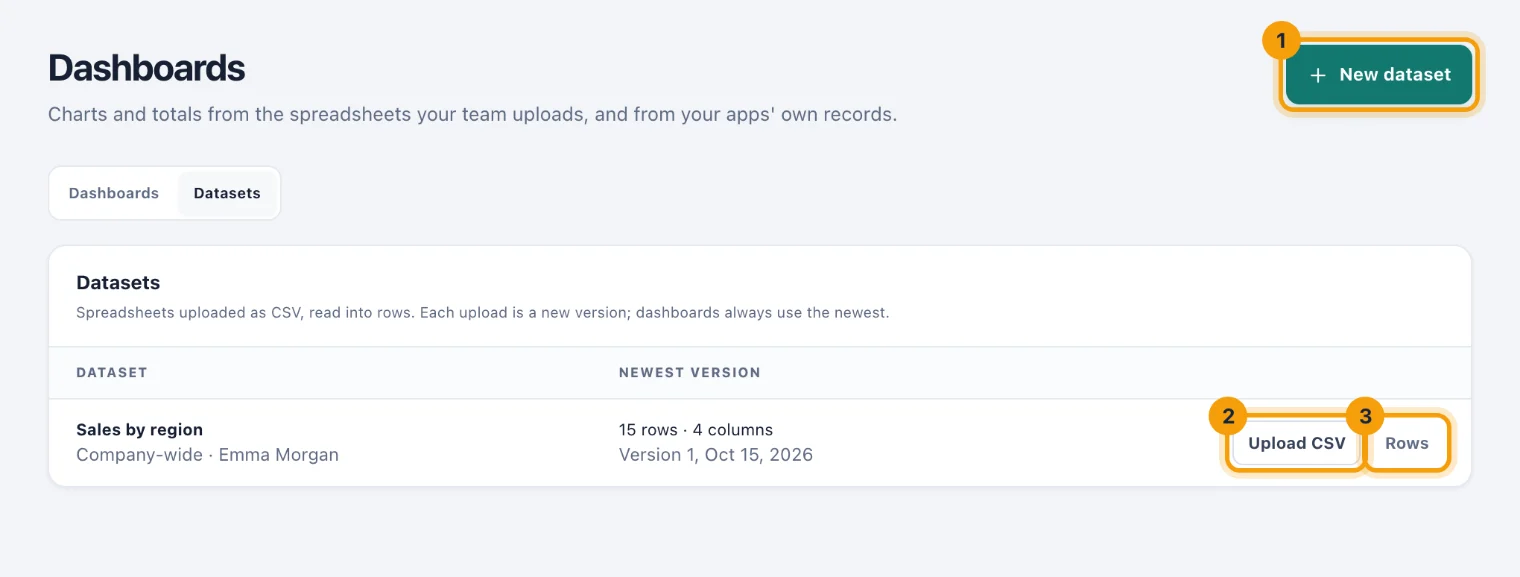
Add a dataset
Choose New dataset (1).
Give it a Name, such as "Sales by region".
In Kept for, choose The whole company, or one location. The people who build dashboards there can use it; a dataset for the whole company needs the permission across the whole workspace.
Say what it holds in What it holds (optional).
Choose Add dataset. The upload dialog opens next.
Upload a spreadsheet
In your spreadsheet application, save the sheet as CSV, with the column names on the first line.
Choose Upload CSV on the dataset's row (2), or carry on from Add dataset.
Choose the file, then Upload and read.
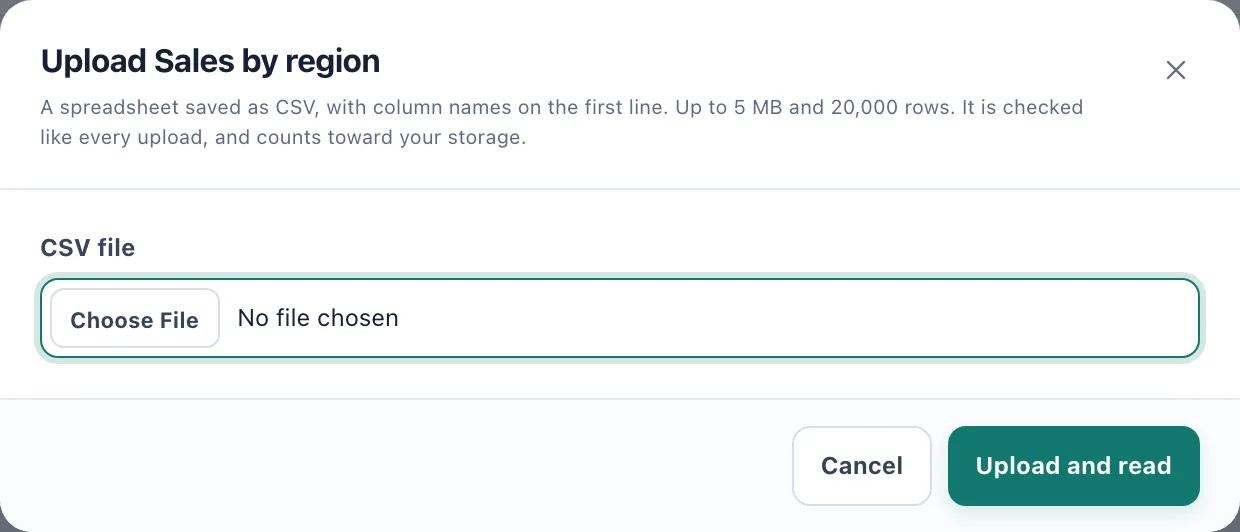
Upload a CSV: up to 5 MB and 20,000 rows. When it has been read, you are told how many rows and columns it holds.
A file can be up to 5 MB, 20,000 rows and 50 columns. It is checked for viruses like every upload, and counts toward your workspace's storage. A file that fails the check is refused, and nothing is read from it.
The Newest version column shows the row and column counts, the version number and when it was uploaded. Upload again whenever the spreadsheet changes: every dashboard on the dataset reads the new version straight away.
How columns are read
Each column is read as one of three kinds:
Number, when every value in it is a number. Commas between thousands are fine; a currency symbol or a percent sign makes it text.
Date, when every value is a date written as year-month-day, such as 2026-09-30, or as day/month/year, such as 30/09/2026.
Text, for everything else.
An empty cell is left empty in any kind of column. Only number columns can be added up or averaged, and only date columns can carry a line chart.
Check the rows
Choose Rows on a dataset (3) to see its newest version as it was read, 100 rows to a page, with each column's kind under its name. Use it to check that a number column really was read as numbers before you build on it.
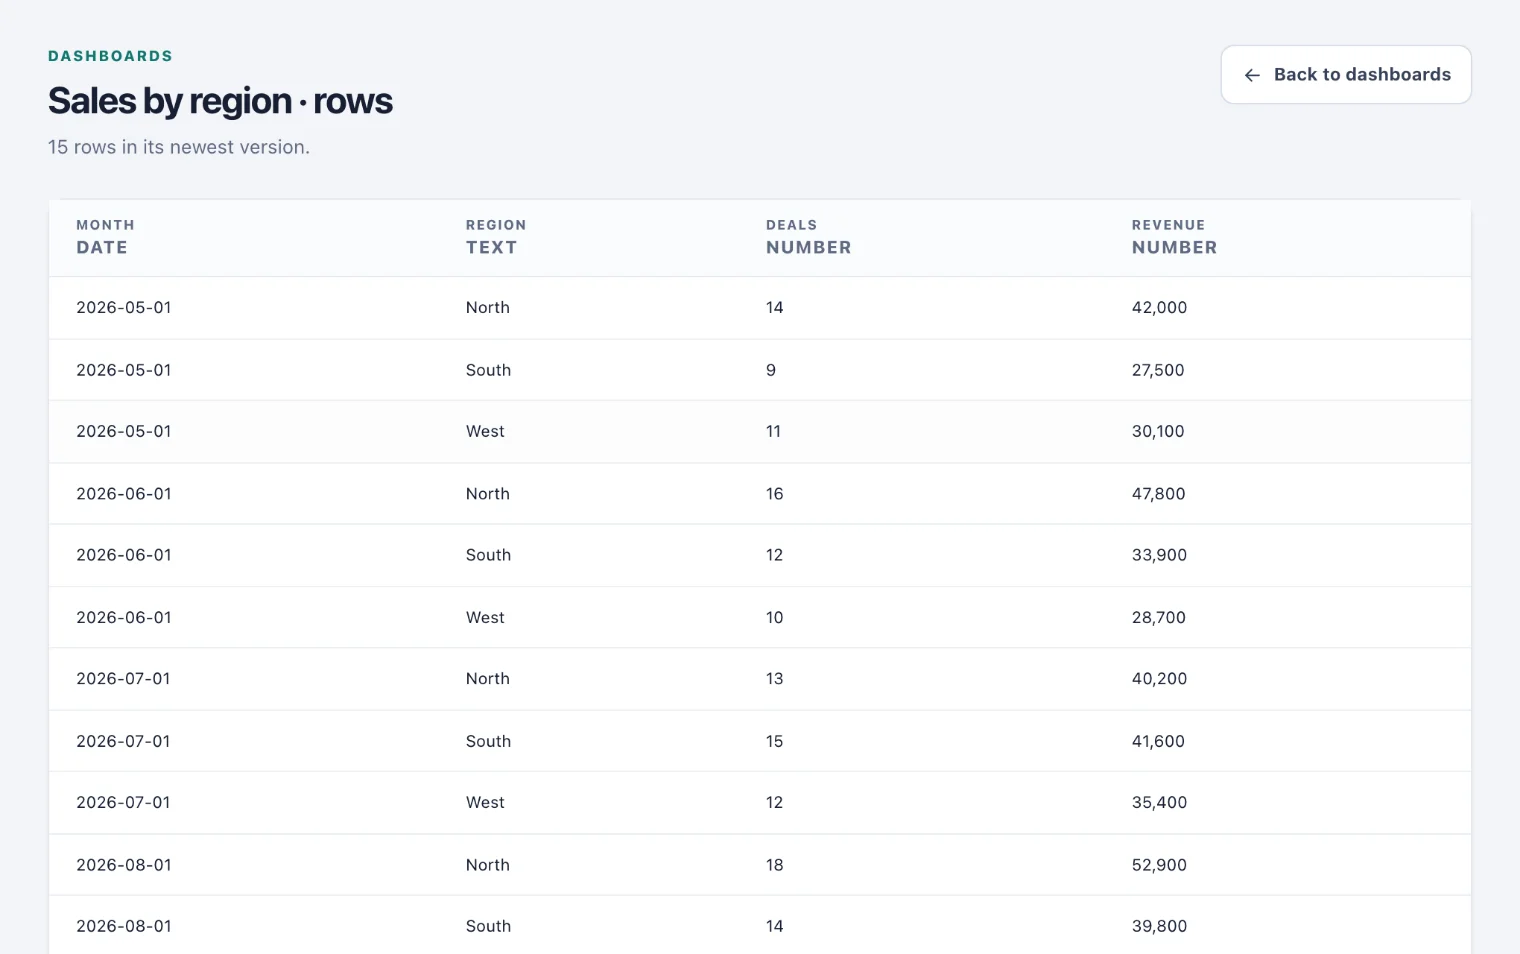
Back to dashboards returns to the list.